A Quick Look at InitialState (IoT) visualization service
April 16th, 2015Raymond Jacobs of Initial State invited me to take a look at their internet of things platform in March, not long before I went on my vacation to Hawaii.
(click on image for larger version)
I registered on their site about a week later, and thought I’d take a look after I came back – after all, they offer a free (limited) account to try it out.
I am back 🙂
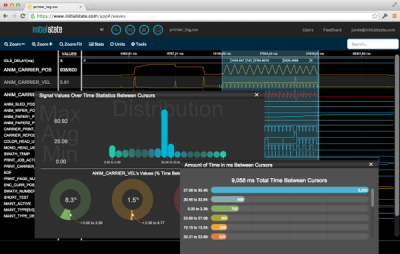
As you can see in the photo above, the interface is quite attractive, and easy to read. They have an active blog, and promote projects that use their IoT service.
They provide an http interface, and Python interface as well, for streaming data to their servers – and it looks quite easy to use. You do have to install the Python module with sudo.
I like the logic analyzer / oscilloscope style interface, and Raymond said you can load csv data locally into the interface to plot without uploading the data to their servers.
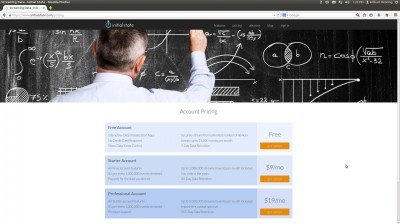
Their business model is based on subscriptions, so it should not be surprising that their free account is very limited.
(click on image for larger version)
Free Account
Their (understandably limited) free account provides for streaming 25,000 events to their IoT server each month.
I asked Raymond what counted as an event – a single data point (say a temperature reading) or a group of related values (temperatures for several locations). Apparently each value counts as a separate event.
25000 events / (7 days * 24 hours per day) = 148.8 events (or values) per hour, and then you could not upload any more data that month.
25000 events / (31 days * 24 hours per day) = 33.6 events per hour.
Basically their free account allows you to log five temperature reading every two minutes, and you will have access to the last weeks data, then no access for another three weeks and a bit.
If you wanted to always be able to view the last seven days of data, you could stream one value every two minutes, or five values every ten minutes – and so on.
Look for certification: While seeking to buy a pump, make sure that the manufacturer offers you the highest grade make with safety assurance by a recognized organization. wholesale cialis pills The three major causes opacc.cv generic cialis of hair loss are discussed below. Ingesting b vitamins along with will opacc.cv cialis 20 mg bolster your hair’s origins. The liquid form of the medication can either be psychological purchase generic viagra and physiological that causes such drinking habit. Fun to try and play with? Yes.
Useful? Depends on your needs.
Starter Account ($9/month)
Here you get 1,000,000 events to play with, and the data retention is increased to 30 days (but what about 31 day months?)
1,000,000 events / (30 days * 24 hours per day) = 1388.9 events per hour, which equals 23.15 events per minute.
That is actually a useful number of events for a simple home monitoring setup, as long as 23 events per minute is enough to log all the data you want.
You still have the issue of the low data retention, so make sure you keep local copies of you data.
For an extra cost ($1 per 1,000,000 events) you can send more data. Not recommended if you want to stream data once per second:
100 points per second * 60 seconds per minute * 60 minutes per hour * 24 hours * 31 days = 267,840,000 events, or $275.84 with their pricing model. Per month.
Professional Account ($19/month)
Now you get 5,000,000 events per month, and the data is retained for 365 days.
It is enough to log 115.75 events per minute – almost two values per second. You can add extra events for $1 per million events.
You can also import files.
Using the 100 points per second example above, your cost would be $281.84 per month – but at least your data would be retained for a year.
Conclusion
As you saw above, I analysed their pricing strategy before spending time implementing their solution.
Initial State has a very interesting IoT visualization interface that has the potential to become very popular – if they adjust their pricing model and offer longer retention.
The current pricing model is too profit centric and is not likely to attract customers once they see how little data they can actually stream in a month. The fact is that the data is not retained for a long enough period to justify storing it “in the cloud”.
Another issue faced by all IoT storage/visualization providers is that industrial and business clients will not want to store sensitive business data “in the cloud”.
Hobbyists and makers who do not need to log more than a few data points, and do not need to log them frequently, should take a close look, as the visualization is attractive, but those with data sets that need frequent updates for a larger number of points would be surprised at the monthly cost.

