Hantek 1008B Oscilloscope
Unfortunately, the signal generator functionality is not documented.
I did find two posts on the Hantek forums that gave a bit of information, however I have yet to really figure it out.
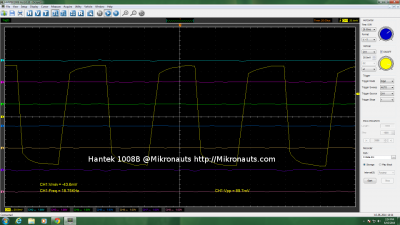
Here is all I was able to find on signal generation:
(18.75kHz signal generated by the integrated signal generator – click on the image above for a larger view)
There is a lot of functionality packed into the software, too much for me to go into detail in this article. Fortunately, you can download the manual and software from Hantek to read more about it.
Testing the actual bandwidth of the Hantek 1008B oscilloscope
I used the RoboPi on the better mousetrap servo tester to generate a 50kHz square wave signal as I thought that would be a good way of testing the bandwidth limitations of the Hantek 1008B.
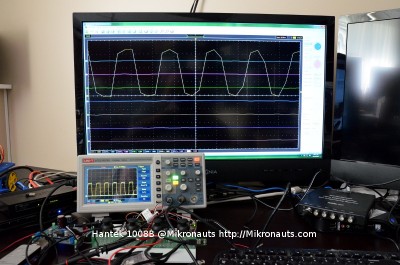
(8 channels at 10us/div 50kHz square wave – click on the image for a larger photo)
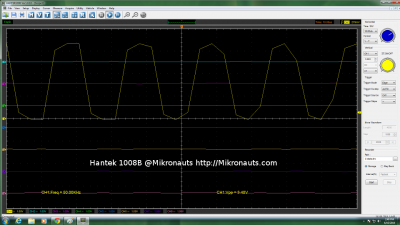
The 50kHz signal is clearly visible with all eight channels sampling, however it does not look much like a square wave – but unlike a logic analyzer, it sill provides some indication of rise and fall times.
Note how my 1Gsps/100Mhz scope does a much better job of showing the square wave.
(click on the image for a larger view)
One nice feature of the Hantek 1008 software is various signal measurements – here you can see the frequency measurement and peak to peak voltage measurement for the 50kHz signal generated by RoboPi
There is also a built in “snapshot” feature for capturing just the oscilloscope display
(click on the image for a larger view)
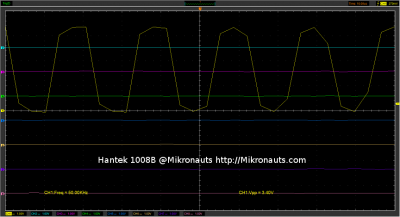
Theoretically, we should get a much better looking signal if we only use one channel – 2.4Msps will give us 480 samples per 50kHz square wave period.
Let’s see if theory is proven IRL:
(click on the image for a larger view)
The 1008B did a very nice job at 2us/div in single channel mode, we can clearly see the rise and fall times (and the scope can measure them for us too).
[Navigate the pages in this article by clicking on the numbers below]


